What exactly is the scale of the housing crisis in Canada? Fortunately, most of the data is pretty straightforward to find. You can go to the Statistics Canada website, grab the housing stock table and the population by age table (click “Add/remove data” to see more years), and pretty quickly arrive at something like this:
| 2016 | 2024 | |
|---|---|---|
| Population > 18 | 29,027,447 | 32,600,713 |
| Units available | 15,507,364 | 16,786,020 |
| Units/person | 0.534 | 0.515 |
| Units needed to get to 2016 levels | - | 630,000 |
I.e. we need 630,000 houses or apartments just to get back to 2016 levels of housing availability. A bit over half of this number comes from Ontario; repeating the math for that province gives us a shortage of 333,000 units compared to 2016.
To be clear, this number misses a lot of nuances: we don’t know which of these “units” are 8-bedroom houses and which are micro-condos, and we don’t know which of these adults are single and which have families.
On the surface, this shortage of 630,000 units doesn’t seem too horrifying: in 2023, the construction industry has started building 240,267 new units (CMHC housing starts table) — down from the peak of 271,198 in 2021 — so it might look like it should take a bit less than three years to catch up.
But remember: Canada is a growing country, so as we’re building these housing units, new people over 18 are appearing. So let’s update our math. Suppose Canada’s growth follows StatCan’s moderate growth projections (M2 scenario in this table), and we continue building houses at the same rate as we did in 2021 (the best year we’ve seen so far). How long will it take to catch up to the 2016 housing level?
Well, then the projection looks something like this:
| Year | Population > 18 | Units short |
|---|---|---|
| 2025 | 33,283,800 | 577,130 |
| 2026 | 33,548,800 | 495,079 |
| 2027 | 33,822,800 | 418,454 |
| 2028 | 34,312,900 | 457,893 |
| 2029 | 34,800,100 | 496,398 |
| 2030 | 35,280,800 | 532,044 |
| 2031 | 35,761,400 | 568,248 |
| 2032 | 36,241,000 | 604,527 |
| 2033 | 36,715,500 | 638,690 |
| 2034 | 37,187,400 | 672,071 |
| 2035 | 37,652,100 | 702,210 |
Uh-oh, we never catch up.
So what will it take?
I’ll spare you the math and go straight to the answer: if we want to get back to 2016 housing stock levels by 2035, then over the next five years we need to increase the housing starts by 26% over the 2021 levels to about 380,000 starts/year, with the bulk of this increase happening in Ontario, which needs to raise its housing starts by ~45%.
It’s not a small amount, but not impossible either. For comparison, in the years between 2016 and 2021, housing starts have increased 37% Canada-wide ans 33% in Ontario.
Like thoughtful, evidence-based policy? If you’re in Canada, check out the new centrist Canadian Future Party. A good intro is this press conference introducing the party.
But there are a few problems in the way
A lot of the discourse online and among activists has been focused on onerous regulations, slow approvals, and unhelpful building codes — and rightfully so. That said, these seem to be improving as the public mood shifts towards building more housing, and, looking at the industry reports, it seems like at least some of the insiders no longer see the public policy as the biggest long-term drag on construction.
There are a couple of other major problems though.
First, we need the new housing starts to go up, but instead since 2021, they’ve been going down. The explanation for this is fairly straightforward: less money has been spent on building new houses because the interest rates have gone up and house purchases have slowed down.
This problem will partly fix itself as the Bank of Canada lowers its policy interest rate. However, it won’t cut the rate back down to 0.25%, and the total investment into new housing isn’t projected to go back up to the 2021 levels either (source: BuildForce National Summary for 2024):
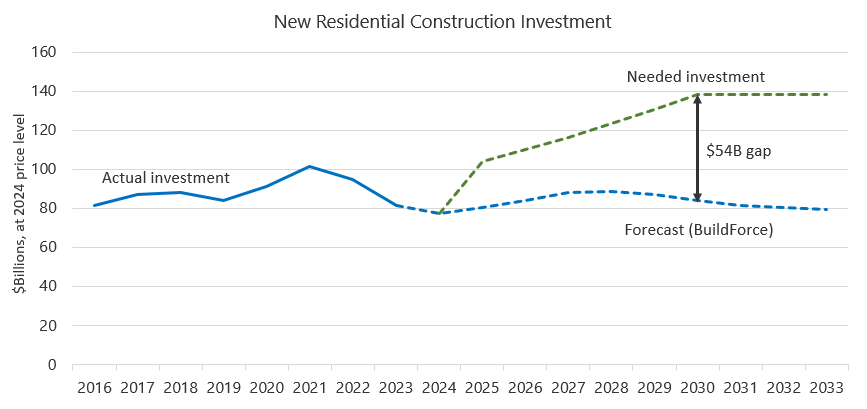
But we need the investment to go much higher: if the average historic costs per housing unit stay the same, we’ll need to be investing as much as $54 billion per year more than we’re forecast to catch up to our 2016 housing availability target. If that money doesn’t materialize from somewhere, no amount of regulation reform will help plug the gap.
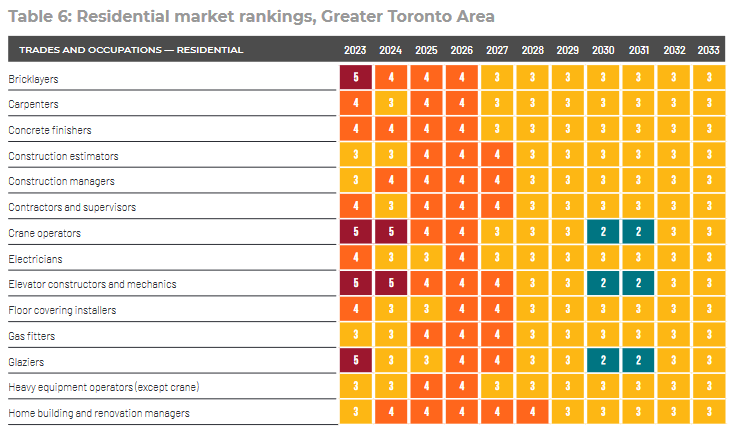
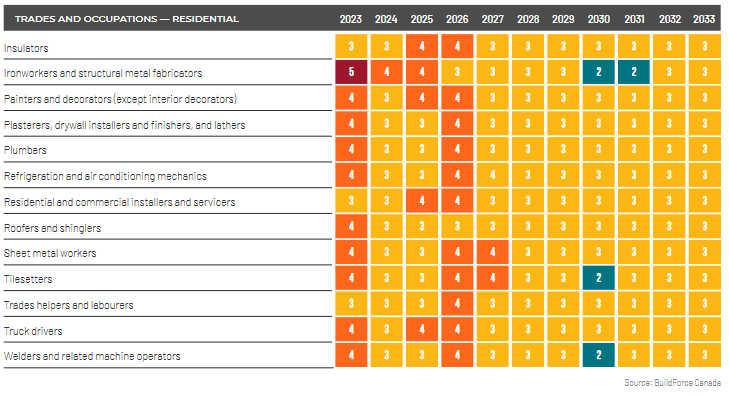
The second problem is the shortage of skilled labor in the construction industry, which is projected to worsen due to retirement. In the short-term, construction is limited by lack of people with a few specific skill sets like crane operators, elevator mechanics, or ironworkers, especially in major cities like Toronto (source: BuildForce Ontario report 2024):
In the long-term, from the same report, based on the current hiring levels and trades education pipeline, Ontario alone is expected to be short 35,500 construction workers by 2033 — and that’s assuming BuildForce’s own not-quite-adequate construction investment forecast seen in the earlier graph. To get back to 2016 affordability levels in a reasonable time, we’d need to find more skilled construction workers somewhere, either by attracting more young people to trades locally, or through immigration.
Or… what if we lower the population growth?
While we work on addressing the supply-side issues of housing, there’s one lever in the hands of the federal government that can easily control the demand side: immigration levels.
How will the changes to the immigration policy affect the outcomes?
Let’s tweak some numbers and redo the math:
- StatCan’s M2 growth projection scenario already assumes a net departure of around 212k non-permanent residents per year between 2025 and 2027. That’s roughly consistent with reducing foreign students to about 2019 numbers and losing about half of the temporary foreign worker permit holders. Let’s keep this as-is.
- The current permanent resident admission target is 500k/year. Let’s lower it to 350k until 2035, which will still keep it mostly above the historic levels and at around 0.8% of the current population.
Let’s keep the construction industry output at their 2021 levels and see what the situation looks like:
| Year | Population > 18 | Units short |
|---|---|---|
| 2025 | 33,283,800 | 668,723 |
| 2026 | 33,548,800 | 521,036 |
| 2027 | 33,822,800 | 382,890 |
| 2028 | 34,312,900 | 250,171 |
| 2029 | 34,800,100 | 233,516 |
| 2030 | 35,280,800 | 215,927 |
| 2031 | 35,761,400 | 195,478 |
| 2032 | 36,241,000 | 175,588 |
| 2033 | 36,715,500 | 155,773 |
| 2034 | 37,187,400 | 111,129 |
| 2035 | 37,652,100 | 85,173 |
We gradually catch up! Not quickly, but the effects should start being felt after the first year, and should improve every year after that. And if the construction industry raises its output by just 3%/year (for a total of 12% in 5 years), we get to 2016 housing availability levels by 2031.
Conclusions
It took a while to get into the current housing crisis, and it will likely take a while to get out. Whoever ends up taking on this will have their work cut out for them.
We’ll need:
- The federal government doing its part in controlling the demand by managing the immigration levels.
- Cities and provinces, especially Ontario and BC, to keep pushing for regulatory reforms;
- Provinces continuing to expand capacity for trades education and making it more attractive for young people;
- The construction industry finding ways to build better houses and apartments for less;
- Figure out how to keep funding flowing into the construction industry;
Whatever happens, I will keep following this with great interest.