In 2023, Toronto had a pretty interesting mayoral election. Not just because John Tory abruptly resigned after having an affair with a staffer, but also because his successor — Olivia Chow — has won the subsequent election with only 37% of the vote. Though she has been a decent mayor so far, we have no way of definitively knowing that she was really the choice preferred by most Torontonians in a 1v1 matchup against any other candidate.
It’s not hard to find even more extreme outcomes under the first-past-the-post system. Take, for example, this 2021 Canadian federal election result in the electoral district of Coast of Bays—Central—Notre Dame, where a vote split on the left has definitely produced a winner that the majority of the voters didn’t want:
| Party | Candidate | Votes | % |
|---|---|---|---|
| Conservative | Clifford Small | 14,927 | 46.89% |
| Liberal | Scott Simms | 14,646 | 46.00% |
| New Democratic | Jamie Ruby | 2,261 | 7.10% |
So how can we make the system more representative?
At the federal or provincial level, if we’re looking for fairer representation, we’d probably want to add some element of proportionality to the outcomes (which, incidentally, is the position of my new favorite party, Canadian Future Party). But that’s not a universal fix: it wouldn’t help with the municipal elections, and under some proportional systems like MMR, we’d still need a solution for the electoral districts.
What about ranked-choice voting?
A commonly suggested solution to this dilemma is ranked voting, also called “single transferrable vote” or “alternative vote”, where each voter ranks each candidate in order of preference. Here’s a classic CGPGrey video with a 4-minute explanation:
However, ranked voting comes with its own issues. Its tabulations are more opaque, it takes longer to count the results, and it’s harder to run political polls for it. But most importantly it can still produce rather head-scratching outcomes like the one in the 2022 Alaska special house election.
On the surface, this election looks fairly normal. Once all the minor write-in candidates were eliminated, there were three main candidates left:
| Party | Candidate | Votes | % |
|---|---|---|---|
| Democratic | Mary Peltola | 75,799 | 40.19% |
| Republican | Sarah Palin | 58,973 | 31.27% |
| Republican | Nick Begich | 53,810 | 28.53% |
After Nick Begich was eliminated, most of his vote was redistributed to Sarah Palin, but enough went to Mary Peltola that she ended up winning in the last round:
| Party | Candidate | Votes | % |
|---|---|---|---|
| Democratic | Mary Peltola | 91,266 | 51.5% |
| Republican | Sarah Palin | 86,026 | 48.5% |
So far so good; this is exactly the way ranked choice is supposed to work. But let’s look at what would have happened if Nick Begich had run 1 vs 1 against either Palin or Peltola. We can do this by eliminating the third candidate and redistributing their votes according to the voters’ preferences:
| Begich vs | Begich votes | Other candidate votes | Winner |
|---|---|---|---|
| vs Mary Peltola | 88,126 | 79,486 | Begich |
| vs Sarah Palin | 101,438 | 63,666 | Begich |
Isn’t that interesting? Begich was the preferred choice against either candidate but he was eliminated first. One could certainly argue something like “If the voters would have wanted Begich, they should have picked him first”. But given that most voters would have preferred Begich to Peltola, it’s also hard to argue that the election outcome represents the true will of the people.
Turns out that this is a known systemic flaw in ranked choice ballots, and it’s known as the center-squeeze effect.
So what’s the alternative?
Okay, if it’s not going to be ranked choice, then what? There’s a surprising variety of voting systems, each with its own tradeoffs in voter satisfaction efficiency, execution complexity, and susceptibility to weird effects. If you want to dive into the details, check out Voter Satisfaction Efficiency Simulator and Simulating Elections with Spatial Voter Models. And, unfortunately, there is no one perfect voting method to rule them all.
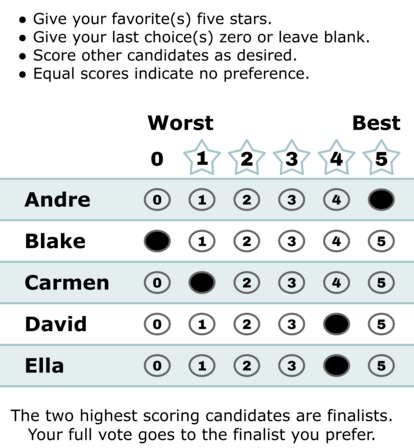
But I think there’s one method that strikes a great balance between fair representation and simplicity: a simple candidate rating, also called “score voting”.
It goes like this:
- When voting, assign each candidate a score between, say, 0 and 5.
- When counting the results, the candidate with the highest average rating wins.
Here’s what a score voting ballot could look like:

It’s intuitive, it’s simple to tabulate, and most people will get it right away because it works just like product/restaurant/hotel/etc ratings that they’ve been already using.
What’s the downside?
There have been a few criticisms of score voting.
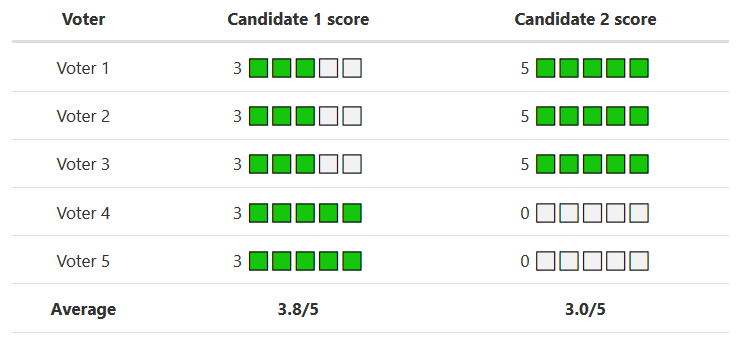
First, the most preferred candidate is not always the winner. Take a look, for example, at this hypothetical election result:
| Voter | Candidate 1 score | Candidate 2 score |
|---|---|---|
| Voter 1 | 3 🟩🟩🟩⬜️⬜️ | 5 🟩🟩🟩🟩🟩 |
| Voter 2 | 3 🟩🟩🟩⬜️⬜️ | 5 🟩🟩🟩🟩🟩 |
| Voter 3 | 3 🟩🟩🟩⬜️⬜️ | 5 🟩🟩🟩🟩🟩 |
| Voter 4 | 3 🟩🟩🟩🟩🟩 | 0 ⬜️⬜️⬜️⬜️⬜️ |
| Voter 5 | 3 🟩🟩🟩🟩🟩 | 0 ⬜️⬜️⬜️⬜️⬜️ |
| Average | 3.8/5 | 3.0/5 |
So Candidate 2 loses the election, even though the majority of the electorate would have preferred them. But this time we have a good explanation: Candidate 2 appears to be very polarizing, while Candidate 1 is at least acceptable to everyone, so we could argue that this is really a feature of the system, not a bug.
Second, rating-based voting systems are vulnerable to strategic voting in a way that can backfire pretty badly. This can happen, for example, in a three-candidate election where candidates 1 and 2 are close in voter preference, but the voters strategically give 0/5 rating to their second preferred candidate in order to make sure that their favorite wins. If enough voters do that, it can inadvertently produce a result like this:
| Voter | Candidate 1 | Candidate 2 | Candidate 3 |
|---|---|---|---|
| 1 | 5 🟩🟩🟩🟩🟩 | 0 ⬜️⬜️⬜️⬜️⬜️ | 0 ⬜️⬜️⬜️⬜️⬜️ |
| 2 | 5 🟩🟩🟩🟩🟩 | 0 ⬜️⬜️⬜️⬜️⬜️ | 0 ⬜️⬜️⬜️⬜️⬜️ |
| 3 | 0 ⬜️⬜️⬜️⬜️⬜️ | 5 🟩🟩🟩🟩🟩 | 0 ⬜️⬜️⬜️⬜️⬜️ |
| 4 | 0 ⬜️⬜️⬜️⬜️⬜️ | 5 🟩🟩🟩🟩🟩 | 0 ⬜️⬜️⬜️⬜️⬜️ |
| 5 | 0 ⬜️⬜️⬜️⬜️⬜️ | 0 ⬜️⬜️⬜️⬜️⬜️ | 5 🟩🟩🟩🟩🟩 |
| 6 | 0 ⬜️⬜️⬜️⬜️⬜️ | 0 ⬜️⬜️⬜️⬜️⬜️ | 5 🟩🟩🟩🟩🟩 |
| 7 | 0 ⬜️⬜️⬜️⬜️⬜️ | 0 ⬜️⬜️⬜️⬜️⬜️ | 5 🟩🟩🟩🟩🟩 |
| Average | 1.4/5 | 1.4/5 | 2.1/5 |
And we’re back to vote-splitting of first-past-the-post! Though on the bright side, hopefully, outcomes like this would discourage voters from strategic voting.
Finally, it’s still a more complex voting system than first-past-the-post, and it may take a while for the voters to get used to it.
 Bluesky
